


 Photo: FASTILY, CC BY-SA 4.0, via Wikimedia Commons
Reno and Sparks are one metro area but many different places to live. The Census Bureau publishes data by ZIP code tabulation area, and these figures describe the whole ZIP, which sometimes covers more than one neighborhood. Treat the table as a map of tendencies and check any address in person.
The numbers by ZIP code
The table uses the American Community Survey for 2020 to 2024. Home values and rents are medians for the ZIP.
| ZIP | Area | Median home value | Median rent | Renters | Median year built |
|---|---|---|---|---|---|
| 89501 | Downtown and Midtown Reno | 414,000 | 1,245 | 77.8 percent | 1975 |
| 89502 | East Reno, airport, Southeast Reno | 413,200 | 1,361 | 64.3 percent | 1977 |
| 89503 | University and North Reno | 467,200 | 1,438 | 54.4 percent | 1975 |
| 89509 | Old Southwest Reno | 703,700 | 1,495 | 44.5 percent | 1975 |
| 89519 | Caughlin Ranch | 932,900 | 2,082 | 23.6 percent | 1993 |
| 89523 | Northwest Reno, Somersett, Mogul | 607,300 | 1,845 | 39.2 percent | 1999 |
| 89521 | South Reno, Damonte Ranch | 667,700 | 2,147 | 31.1 percent | 2007 |
| 89511 | South Meadows, Galena, Montreux | 916,600 | 1,925 | 30.7 percent | 1997 |
| 89506 | North Valleys, Stead | 410,700 | 1,848 | 29.3 percent | 1999 |
| 89431 | Northwest Sparks | 365,100 | 1,348 | 54.5 percent | 1973 |
| 89434 | Vista, Sparks | 457,000 | 1,914 | 37.0 percent | 1987 |
| 89436 | Wingfield Springs, Sparks | 588,500 | 2,128 | 25.3 percent | 2004 |
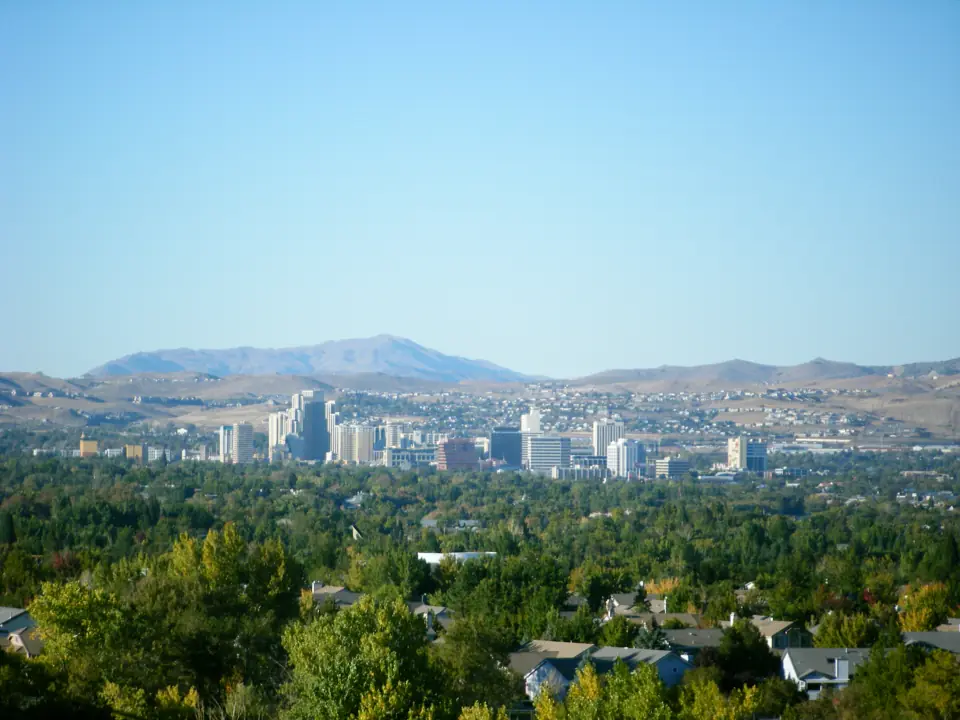
Downtown, Midtown and the older core
The oldest parts of the valley have the lowest values and the most renters. ZIP 89501 has a median home size of 2.2 rooms and only 3.5 percent single-family houses, which tells you apartments and condos dominate. East Reno (89502) and University and North Reno (89503) have median home values in the 400,000s and median build years in the mid-1970s. See Downtown and Midtown, Southeast Reno and North Reno and University.
Old Southwest and the foothill neighborhoods
Old Southwest Reno (89509) combines mature streets with a median home value of 703,700 dollars, and 56.8 percent of its homes are single-family. Caughlin Ranch (89519) is the highest-priced ZIP in this table, with a median household income of 155,288 dollars and 78.4 percent single-family homes. Galena and Montreux sit in ZIP 89511, which also covers South Meadows, so its figures describe all three. See Old Southwest, Caughlin Ranch and Galena and Montreux.
The newer suburbs
South Reno and Damonte Ranch (89521) has a median build year of 2007, with 73.0 percent single-family homes and a median rent of 2,147 dollars. Northwest Reno and Somersett (89523) has a median build year of 1999. North Valleys and Stead (89506) offer a median home value of 410,700 dollars with newer construction than the core. See South Reno and Damonte Ranch, Northwest Reno and Somersett and North Valleys and Stead.
Sparks
Northwest Sparks (89431) is where the O'Brien's warehouse sits, with the lowest median home value in the table at 365,100 dollars and a median build year of 1973. Vista (89434) and Wingfield Springs (89436) are newer and more suburban; Wingfield Springs has 79.9 percent single-family homes. Read the Sparks page for the whole city, and Sparks vs Reno for a comparison.
How to use this table
Pick two or three ZIP codes, then drive them at the times you would commute and shop. The commuting page gives distances, and the schools page explains why your zoned school should be checked by street address. Once you have an address, a free in-home estimate covers the details of your move.